
-scaled-1.png)
China’s Export Performance in the First Half of 2026: A Comprehensive Report
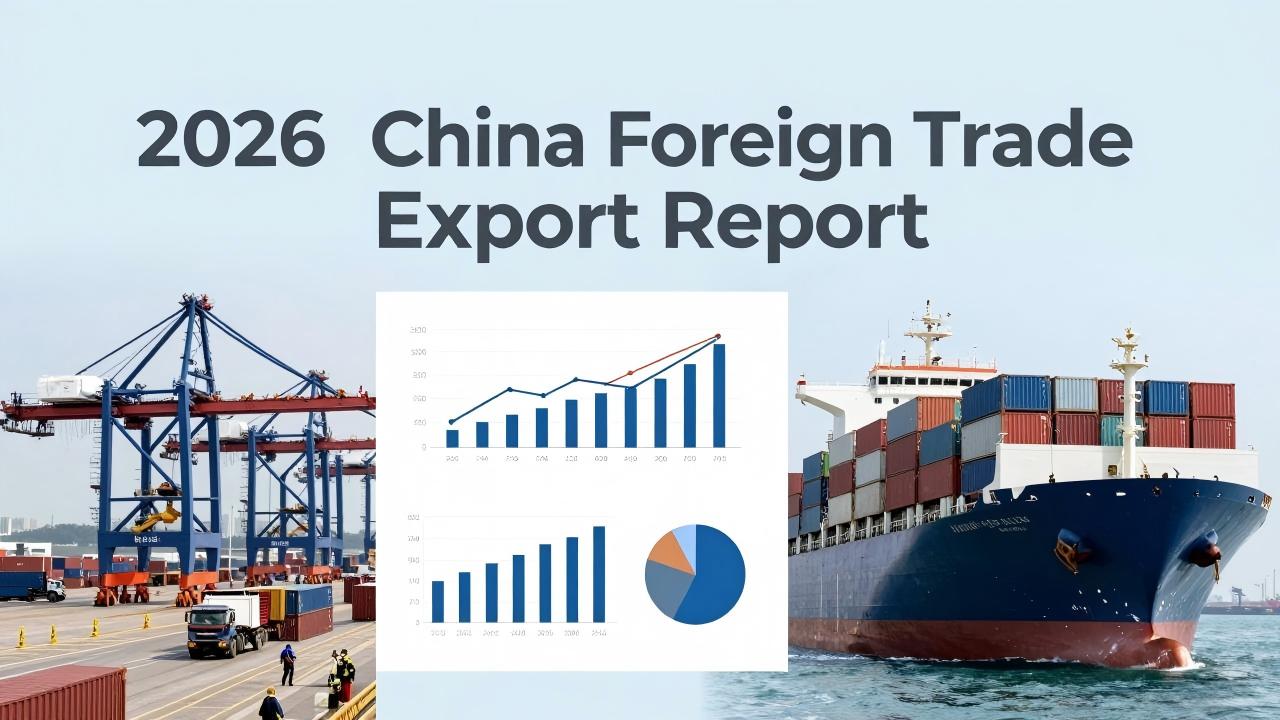
China’s Export Performance-Core Conclusion: Record Scale, Structural Transformation
In the first half of 2026, China’s total goods exports reached 14.73 trillion RMB, a year-on-year increase of13.4%, marking the 11th consecutive quarter of growth and solidifying its position as the world’s largest goods trading nation. The export structure has undergone profound optimization, with high-tech and high-value-added products driving growth, private enterprises contributing over half of total exports, and market diversification accelerating.
I. Export Scale and Growth Drivers
Total Export Value: 14.73 trillion RMB, +13.4% YoY
Monthly Performance: June exports hit 2.82 trillion RMB, up 20.8% YoY — the 17th consecutive month of positive growth
Quarterly Acceleration: Q2 total imports and exports reached 13.61 trillion RMB, growing 18.4% YoY — the highest quarterly growth since Q3 2021
Trade Surplus: $576 billion, a record high for the same period
Key Driver: Amid global supply chain reconfiguration, China’s integrated industrial ecosystem and rapid response capacity continue to meet persistent international demand in renewable energy, smart devices, and consumer electronics.
II. Export Structure: From Quantity to Quality
| Export Category | Value (trillion RMB) | YoY Growth | Share / Notes |
| Mechanical and Electrical Products | 9.36 | 20.1% | 63.5% of total exports; +3.5 pp |
| High-Tech Products | 3.26 | 39% | Fastest-growing segment; includes AI, semiconductors, robotics |
| Branded Exports | — | 25.4% | Share up 2.4 pp |
| New Energy Vehicles (NEVs) | — | 68.7% | Average export price per unit continues rising; global distribution networks expanding |
| Lithium Batteries | — | 37.6% | Global leader in动力电池 exports; paired with energy storage system demand |
| Integrated Circuits | — | ~200% (Xi’an region) | Became the top export category in June; Xi’an alone exported 154.6 billion RMB |
| AI Glasses, AI Translators, Robotic Exoskeletons | — | Rapid iteration | Transitioning from lab prototypes to global consumer markets — forming the “New New Trio” |
Trend Insight: Traditional labor-intensive exports are declining in share. “Technology-driven export” has replaced “price-based export” — China is evolving from the “world’s factory” to the “global innovation supply chain hub.”
III. Major Trading Partners: Structural Rebalancing
| Trading Partner | Export Value (trillion RMB) | YoY Growth | Share of Total Exports |
| Belt and Road Countries | 7.46 | 13.8% | 50.9% |
| ASEAN | 2.75 | 18.5% | China’s largest export market |
| European Union | — | 10.2% | Stable demand for machinery and green tech |
| United States | 1.58 | — | 7.9% of total exports; lowest share in history |
| Africa | — | 19.6% | Strong demand for consumer electronics, appliances, infrastructure equipment |
Structural Shift: The U.S. share in China’s export portfolio has fallen below 8%, while Belt and Road countries now account for over half — a clear success of market diversification strategy.
IV. Business Entities: Private Enterprises as the“Ballast”
Private Enterprise Exports: 10.02 trillion RMB, +12.7% YoY — 57% of total exports
Contribution to High-Tech Exports: Private firms account for 35.9% of high-tech export value, surpassing foreign and state-owned enterprises
New Exporters: 267,000 private firms expanded into new markets in H1 2026; total import-export growth: 22.6%
Policy Support: RCEP, free trade agreements, and zero-tariff policies (covering 63 countries) continue to unlock opportunities — private firms are moving from “daring to go out” to “able to win.”
V. Regional Coordination: East Leads, West and Central Rise
Eastern Region: Accounts for over 20 trillion RMB in imports and exports — 78.8% of national total; still dominated by Yangtze River Delta and Pearl River Delta
Western Region: Exports grew 20.3%; Xi’an (integrated circuits), Chongqing (automobiles), Chengdu (electronic information) emerging as new growth poles
Western Land-Sea New Corridor: Logistics efficiency to ASEAN and Central Asia improved by over 30%; cross-border e-commerce pilot zones enable “small orders, fast turnaround” model
VI. Future Challenges and Emerging Trends
Challenges:
Escalating trade barriers in EU and U.S. (e.g., EU Carbon Border Adjustment Mechanism, U.S. Section 301 investigations)
Gradual substitution of mid-to-low-end manufacturing by Southeast Asian economies
Global inflation and geopolitical instability affecting order stability
Emerging Trends:
“AI + Manufacturing” Export Surge: AI glasses, smart translators, and wearable robotics to become breakout export categories in H2 2026
Green Standards as Entry Barriers: Carbon footprint certification and ESG compliance will become mandatory for market access
Overseas Warehouses + Localized Services: Shift from “selling products” to “selling ecosystems” — building long-term customer loyalty
For related products, please proceed to the product section.